How I Built the Graph
created updated 712 words4 min read
- meta
- building
i got the idea riding a rented scooty back to the dorm. i'd been thinking about how Obsidian shows your notes as a web of dots and lines, and somewhere on that ride it clicked that my cache should have the same thing. that's pretty much how most of my ideas show up, see Night Drives.
if you've never seen one, a Knowledge Graph is just every note drawn as a dot and every link drawn as a line. obsidian has a graph view for it, and i wanted mine to live on the site.
go to the cache and flip the switch next to the heading. the list turns into the graph.
how you get to it
the cache still opens as a plain list of notes, because a list is honestly the fastest way to find something. the switch next to the "cache" heading turns the list into the graph, and flipping it back gives you the list again.
hover a dot and it lights up along with everything it links to, and the rest fades out. click it and you're on that note.
the switch only shows up once there are at least two notes with a link between them. a graph of one dot is just sad.
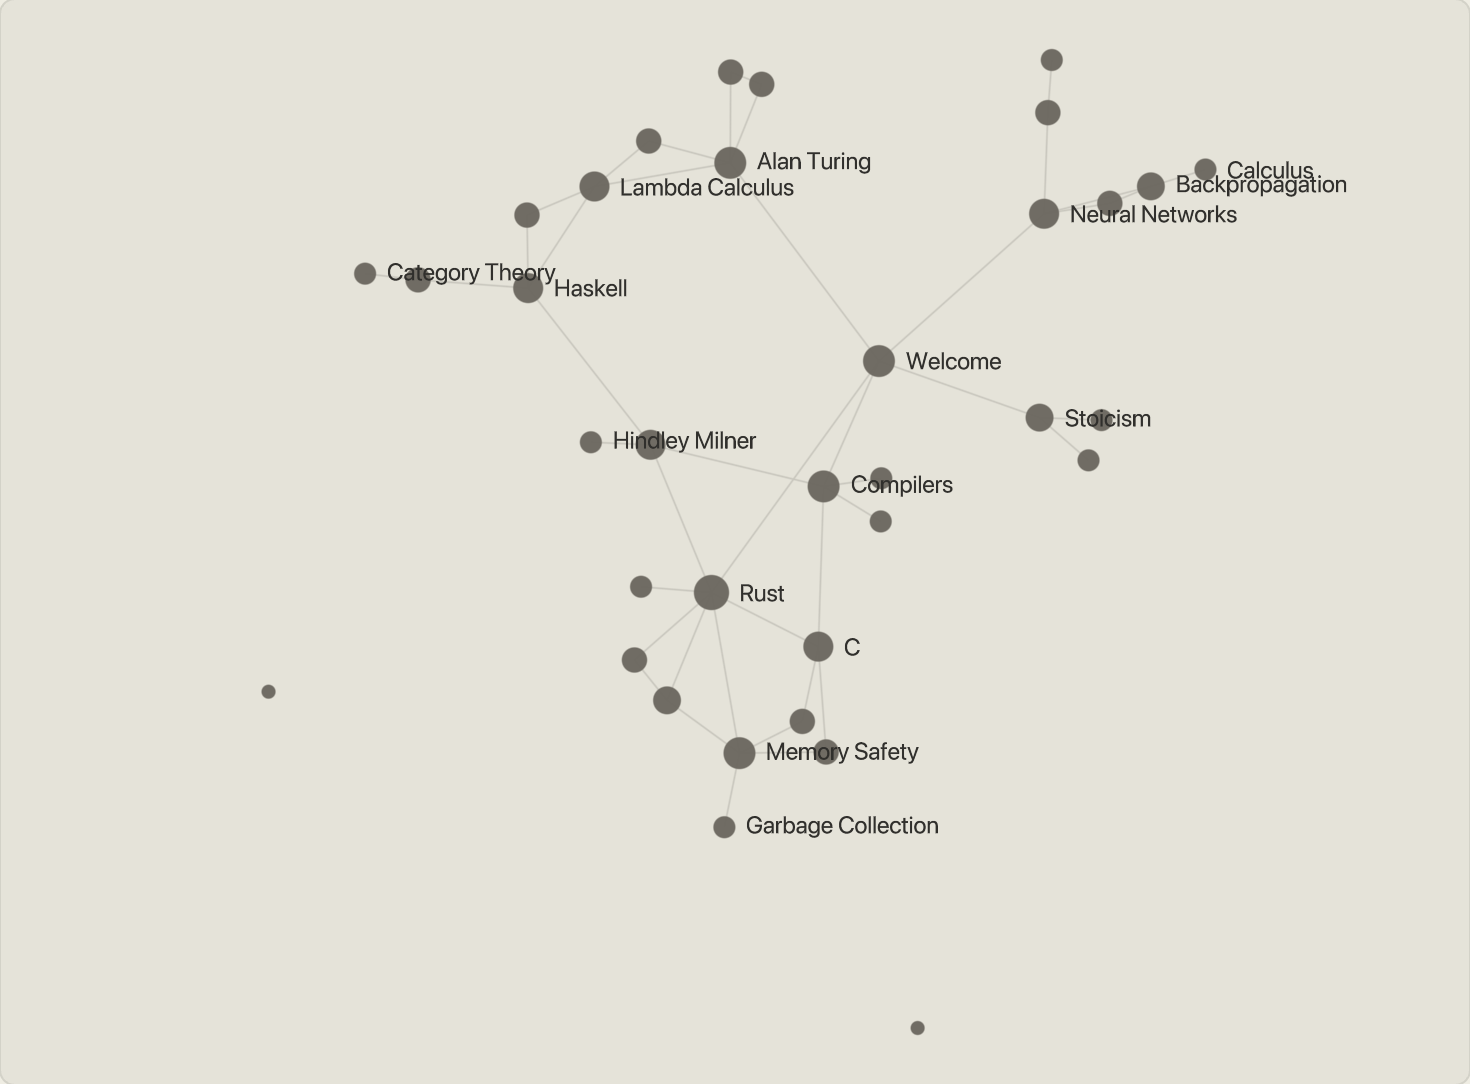
this is the graph on a test vault i made, 35 fake notes, so i could see how it looks with real clusters. mine will get there.
what it's made of
| piece | what it does | link |
|---|---|---|
| sigma.js | draws the whole thing | sigmajs.org |
| graphology | holds the actual graph, the nodes and edges | graphology.github.io |
| ForceAtlas2 | decides where every dot goes | the paper |
| WebGL | lets the browser draw with the gpu | mdn |
sigma renders with webgl, so it should stay smooth even when this thing has thousands of notes. i looked at d3-force and a couple of react graph libraries too, but sigma was the one that wouldn't fall over later.
the part i like
the layout doesn't run in your browser. it runs once, when the site builds.
every note starts on a circle, ForceAtlas2 runs 300 rounds on it, and the final positions get baked into the page. notes that link to each other pull together and everything else pushes apart. your browser only has to draw the result.
so there's no wobbly animation while dots find their place, and you see the same picture every time you visit. i couldn't use random starting positions anyway, because the site is prerendered and Math.random() would give a different graph on every build.
the nerdy bit
this is roughly what runs at build time:
const graph = new UndirectedGraph();
notes.forEach(({ slug }, i) => {
  // start every note on a circle, in title order
  const angle = (2 * Math.PI * i) / notes.length;
  graph.addNode(slug, { x: Math.cos(angle), y: Math.sin(angle) });
});
for (const { slug, linksTo } of notes) {
  for (const target of linksTo) graph.mergeEdge(slug, target);
}

forceAtlas2.assign(graph, {
  iterations: 300,
  settings: forceAtlas2.inferSettings(graph),
});
mergeEdge on an undirected graph means if two notes link to each other, you still only get one line.
the graph code also isn't part of the page. it only loads when you hover or flip the switch, so if you just want the list, you never download any of it.
things that bit me
v4 came out in october 2026, so almost every example online is for v3, and a bunch of the api changed. hover styling used to be done with "reducers". now it's style rules plus node states. i had to read the actual type definitions to get it right.
- WebGL can't read css variables. my colours live in css, so i read them with javascript when the graph mounts and hand sigma real colour values.
- if you give sigma your own styles, it throws away all of its defaults, including the part that tells it where each dot goes. so i start from its defaults and override on top.
what's next
labels still overlap when a cluster gets tight, and maybe each note gets a tiny graph of just its own neighbours. for now it's one big knowledge graph, which is exactly what i said this place would become back in Welcome.